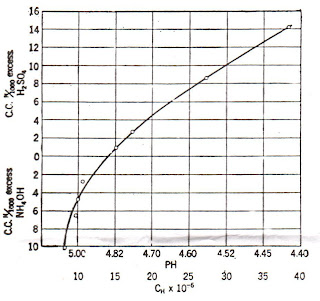
In this activity, ratio and proportion was used to find the numerical values of a digitally scanned plot above. The following steps were followed:
1. The plot was cropped using Paint.
2. Paint was used to find the pixel locations of the data points considered in the plot.
3. MS Excel was used to determine the numerical values in the scanned plot.
Note that the +5 in Xphys value is due to the fact that the original plot started at (5,0) and not at (0,0).
The reconstructed plot superimposed with the original plot is shown below:
1. The plot was cropped using Paint.
2. Paint was used to find the pixel locations of the data points considered in the plot.
3. MS Excel was used to determine the numerical values in the scanned plot.
- All pixel locations were adjusted such that the pixel location of the origin (121,452) becomes (0,0). Hence all pixel locations of the data points were adjusted using the formula
X = Xpixel - 121
Y = 452 - Ypixel
where Xpixel and Ypixel are the pixel locations of the data points.Y = 452 - Ypixel
- The numerical values were determined using the formula
Xphys = (X*Xp)+5
Yphys = Y*Yp
where Xp = 5/107.1429 and Yp = 2/53.30769 are number of pixels per division in the X and Y axis, respectively.Yphys = Y*Yp
Note that the +5 in Xphys value is due to the fact that the original plot started at (5,0) and not at (0,0).
The reconstructed plot superimposed with the original plot is shown below:
 Notice also that the reconstructed plot has a minimum of -12 instead -10 in its axis. This is because the lowest point in the plot has a y value of less than -10 as can be seen from the original plot. The formula used to get the numerical values are applicable only if the plot considered has axes of equal intervals per division. It can also be used without the +5 offset if the plot considered has an origin at (0,0)
For this activity, I give myself a score of 8/10 since I didn't finish it during class hours. I would also like to acknowledge Janno and Raffy for teaching me how to superimpose the original and reconstructed plots using Open Office and Kaye for her suggestions on offsetting the pixel locations.
The original plot was taken from the book "Outlines of Biochemistry" by Gortner, R. published in 1938. **
**no title page was available from the book
To align the plots, crop the scanned image as close as possible to the x and y axis. In this way, the graphs will align in their origins. Never mind if the labels are cropped out.
ReplyDelete